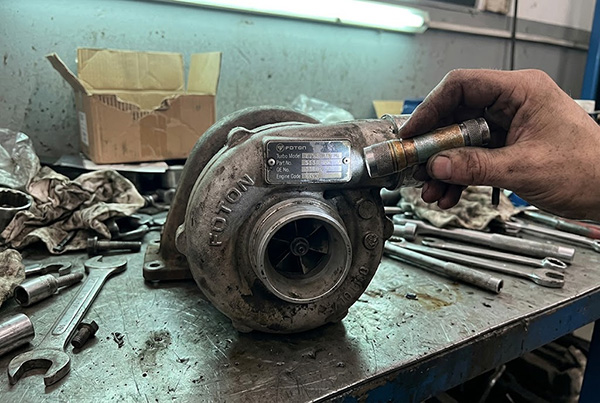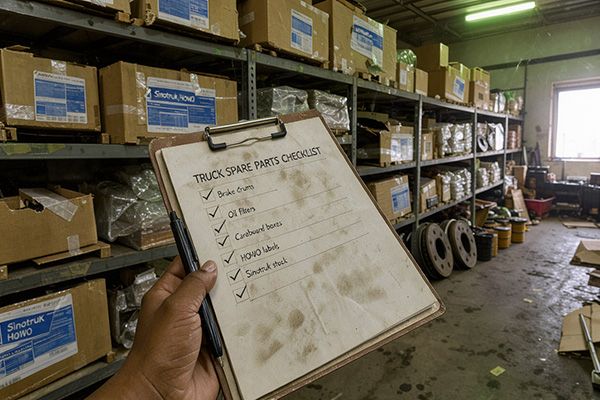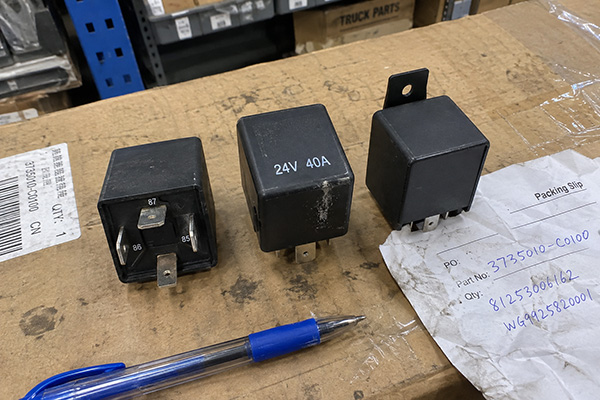
Spare parts planning for Chinese truck fleets sounds simple until your first order arrives and half the brake shoes don't fit. The model name matched and the supplier confirmed compatibility, yet the parts sit on your shelf as dead stock. The problem is rarely the parts themselves. It is the data you started with.
Spare parts planning for Chinese truck fleets requires more than a model name and a catalog. It demands accurate vehicle data — VIN, engine variant, axle configuration, production year — cross-referenced against fleet composition and operating conditions. The output is not a universal list but a validated, fleet-specific stock matrix with built-in reorder logic. Skip a step and you face dead stock, emergency air freight, or idle trucks.
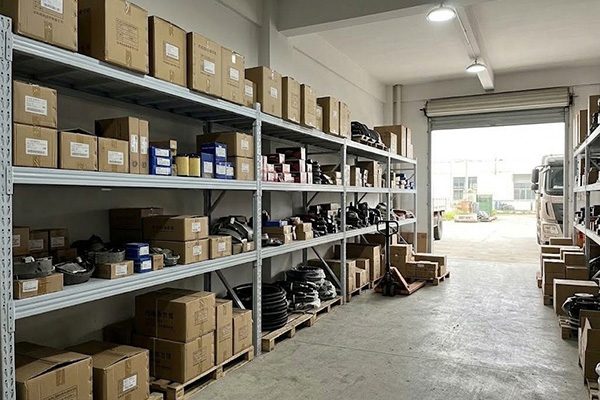
Below I walk through the decision chain we use when helping distributors and fleet operators in Africa, Southeast Asia, and the Middle East build their first stock lists: why model names mislead, which data points matter, what to do when data is missing, and how to set quantities you can validate against real consumption.
Why Is a Truck Model Name Not Enough to Build a Spare Parts List?
A model name tells you the truck family. It does not tell you which parts that truck uses. A list built on the model name alone is a guess, and guesses lead to returns, downtime, and wasted cash.
A single Chinese truck model designation — such as HOWO A7, SHACMAN F3000, or FAW J6 — can cover dozens of assembly configurations[1]. Engine, turbocharger, axle ratio, cabin generation, and emission standard can all differ under the same name. Two trucks with identical badges may need different oil filters, clutch plates, and brake drums.
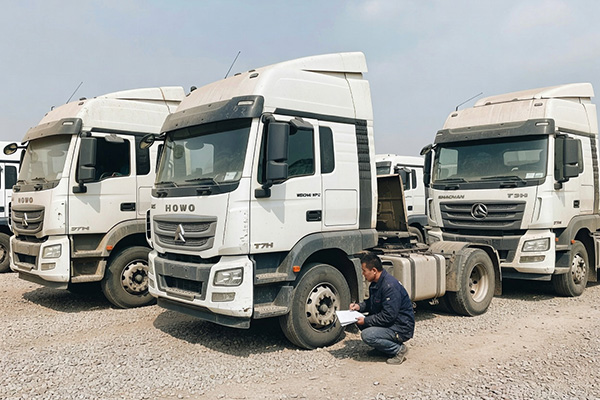
The Model Name Problem in Practice
In our experience matching parts for East African and Southeast Asian fleets, the HOWO name alone covers several platform generations. A 2012 HOWO and a 2019 HOWO may share a cab silhouette but differ in engine, transmission, and even frame details[2]. The table below is a simplified illustration, not a cross-reference:
| Attribute | HOWO A7 (2012 era) | HOWO A7 (2017 era) | HOWO T7H (2019+) |
|---|---|---|---|
| Engine series | WD615 | WD10 / MC11 | MC11 / MC13 |
| Emission standard | Euro II / III | Euro III / IV | Euro IV / V |
| Transmission | HW19710 | HW19712 | HW19712T |
| Brake type | Drum (standard) | Drum / Disc options | Disc (common) |
| Cabin mounting | 4-point spring | 4-point air (some) | 4-point air (standard) |
A buyer who orders "HOWO A7 brake drums" without the production year and brake configuration risks receiving dimensionally wrong parts. We see the same with clutch pressure plates, fuel injection pumps, and even air filter elements, because the engine variant determines the filter housing size.
Running Changes Compound the Problem
Manufacturers also make mid-cycle running changes: a new water pump supplier, a different gasket material, a modified bracket — all without changing the model designation[3]. These changes live in the factory Bill of Materials (BOM) but rarely appear in aftermarket catalogs. That is why the model name is a starting point for conversation, not a specification for ordering.
Which Vehicle Data Points Actually Determine the Right Parts?
A common question we receive is: "What information do I actually need to send you?" For critical components, imprecise matches are not acceptable.
The minimum reliable data set is the VIN (chassis number), the engine nameplate data, the transmission model, and the production year. Axle and suspension parts also need the axle model; cabin and electrical parts need the cabin variant and wiring harness generation. Every missing data point forces an assumption, and assumptions are where mismatches start.
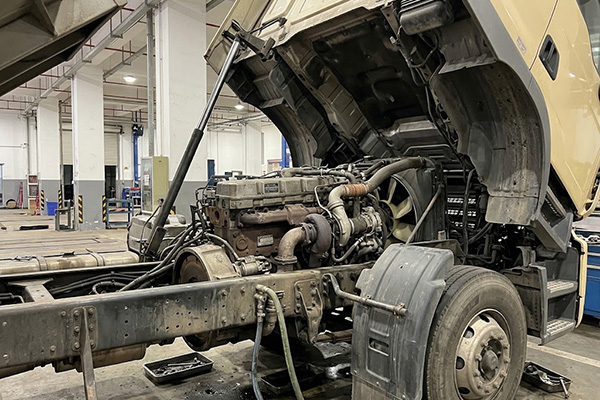
Decoding the VIN Structure
Chinese truck VINs follow the 17-character international format, though encoding varies by manufacturer. In our daily work the VIN helps narrow down:
- Manufacturer (characters 1–3)
- Vehicle type, engine family, and weight class (characters 4–8)
- Production year (character 10)
- Assembly plant (character 11)
- Production sequence (characters 12–17)
The VIN does not resolve everything. Two SHACMAN X3000 trucks with sequential VINs may have different rear axle ratios, one specified for highway and one for construction work.
The Engine Nameplate: Your Most Valuable Data Source
For engine parts, the engine nameplate is more informative than the VIN. A FAW J6P, for example, may carry a CA6DL2, CA6DM2, or CA6DM3, each with different fuel system and turbocharger configurations. The nameplate gives the engine model and variant code, serial number, displacement, rated power, and emission standard. Photograph every engine nameplate at commissioning and store it with the VIN; this single habit prevents most engine-parts mismatches we see.
Beyond Engine and Chassis: Secondary Data Points
| Component Category | Key Data Point | Why It Matters |
|---|---|---|
| Brake system | Brake type (drum/disc), chamber size | Drum and disc systems use entirely different hardware |
| Clutch | Clutch diameter, spline count | 420mm and 430mm clutch kits are not interchangeable |
| Steering | Pump model, steering gear type | Different assist systems differ fundamentally |
| Electrical | Harness generation, ECU type | Newer trucks use CAN-bus architecture |
| Cabin | High/low roof, wide/narrow | Door handles, mirrors, and seat mounts differ |
What Should You Do When Chassis or Engine Data Is Incomplete?
This is the scenario we meet most often. A fleet manager sends a WhatsApp photo of a faded VIN plate, the engine nameplate was painted over, and the secondhand truck has no documents. Now what?
When data is incomplete, the goal shifts from direct lookup to triangulation. Combine a partial VIN, photos of physical parts, a likely production-year range, and visible component features, then cross-reference them against known assembly configurations. A skilled supplier can narrow the options, but some uncertainty remains and must be managed through verification before committing to large quantities.
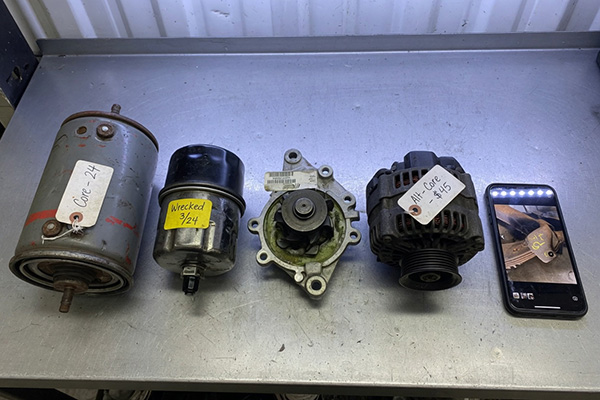
A Practical Triangulation Process
- Collect what you can. Even characters 1–8 and 10 of a VIN narrow the manufacturer, family, and approximate year.
- Photograph the components. Filter housings, brake chambers, and instrument clusters often reveal more than a faded plate through shapes, mounting patterns, and connectors.
- Look for component part numbers. Alternators, starters, turbochargers, and water pumps often carry their own numbers that trace back to an assembly BOM.
- Ask drivers and mechanics. They know what has been replaced and what keeps failing.
- Order high-confidence items first. Hold back ambiguous items until a sample or more photos confirm them.
Managing Residual Uncertainty
If we cannot confirm a match with high confidence, we say so and discuss options: order a single sample for physical verification, choose the more common variant and check fit on arrival, or mark the item "pending verification" on the stock list instead of ordering blind. Experience across 40,000+ SKUs for HOWO, SHACMAN, FAW, FOTON, and DONGFENG helps us resolve ambiguity faster, but it does not replace physical verification.
How Does Fleet Composition Change the Parts Matrix?
Two fleets of the same size can need completely different stock strategies. Homogeneity, age profile, application, and brand mix all matter.
A homogeneous fleet — 50 HOWO 6x4 tippers of the same model year — allows standardization, bulk buying, and shared components. A mixed fleet of SHACMAN tractors, FOTON trucks, and DONGFENG distribution trucks fragments the list, raises SKU count, lowers per-item volume, and demands more precise identification. Your parts matrix must reflect your actual fleet, not an idealized single-brand one.
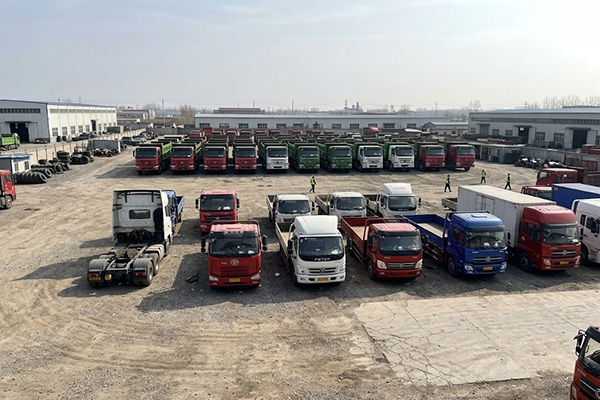
Scenario 1: Homogeneous Mining Fleet
Consider a 50-truck HOWO 371 6x4 tipper fleet in East African mining conditions, all with the same engine, rear axle, and brake configuration. One clutch kit, one brake shoe set, and a small group of filter SKUs cover the whole fleet, and bulk orders cut unit cost. The emphasis shifts to high-wear items consumed at predictable intervals, suspension parts under extreme load (leaf springs, spring pins, U-bolts), cooling parts stressed by dust and heat, and drivetrain parts loaded by steep gradients.
Scenario 2: Mixed Logistics Fleet
Now consider 20 SHACMAN F3000 tractors on highways, 15 FOTON Auman GTL tractors on regional routes, and 10 DONGFENG medium-duty trucks in urban distribution. Few components interchange across brands, service intervals differ, and supplier minimum order quantities may exceed real consumption for low-volume SKUs. The emphasis shifts to brand-specific consumables, broader but shallower stock, standardizing the few cross-brand items (hoses, connectors, bulbs), and relying on supplier responsiveness for slow movers.
Comparing the Two Scenarios
| Planning Factor | 50-Truck HOWO Mining Fleet | Mixed SHACMAN/FOTON/DONGFENG Logistics Fleet |
|---|---|---|
| SKU count | Low (indicatively 150–250 active SKUs) | High (indicatively 400–700 active SKUs) |
| Per-SKU depth | High (bulk quantities justified) | Low (dead-stock risk if over-ordered) |
| Interchangeability | High within fleet | Low across brands |
| Lead-time tolerance | Low (downtime = lost output) | Moderate (trucks can cover for each other) |
| Consumption predictability | Higher (uniform duty cycle) | Lower (mixed duty cycles and ages) |
| Recommended order strategy | Fewer, larger container orders | Frequent, mixed-SKU replenishment |
Your fleet composition dictates your stock list architecture. Treat any "standard HOWO parts list" as a rough starting point, never as universal.
How Do Operating Conditions Shift Parts Consumption?
Even identical trucks wear differently depending on where and how they run. The pattern is clear when we compare repeat orders from different regions.
Dust, heat, road surface, gradient, payload discipline, and fuel quality turn a theoretical service interval into your real consumption rate. A HOWO on paved Southeast Asian highways and an identical HOWO on unpaved African mining roads will consume air filters, brake shoes, and suspension parts at very different rates. Your stock list must account for this.

Key Environmental Multipliers
- Dust. In dusty mining regions, buyers often replace air filters well before the recommended interval[4]. Dust also accelerates wear on turbocharger seals, piston rings, and valve guides[5].
- Heat. Sustained high temperatures stress radiators, water pumps, thermostats, and hoses, and speed up rubber degradation[6].
- Road surface and gradient. Unpaved roads and steep descents raise loads on suspension, brakes, propeller shaft bearings, and half shafts.
- Payload. Routine overloading accelerates wear on clutch facings, leaf springs, wheel bearings, and king pins[7]. Plan for reality, not rated capacity.
- Fuel and lubricant quality. Contaminated or high-sulfur fuel clogs filters and wears injectors[8]; poor oil shortens bearing life.
Adjusting the Stock List for Conditions
Start with the manufacturer's service intervals, then apply a condition-based factor. For severe conditions, indicatively plan 1.5x to 3x standard filter and consumable usage; for brake and suspension parts in mining or mountain work, 2x to 4x.
These ranges are indicative, not engineering specifications. Your own consumption data will confirm or correct them.
What Common Planning Mistakes Lead to Dead Stock or Downtime?
The same mistakes repeat across markets, and each has a predictable financial consequence.
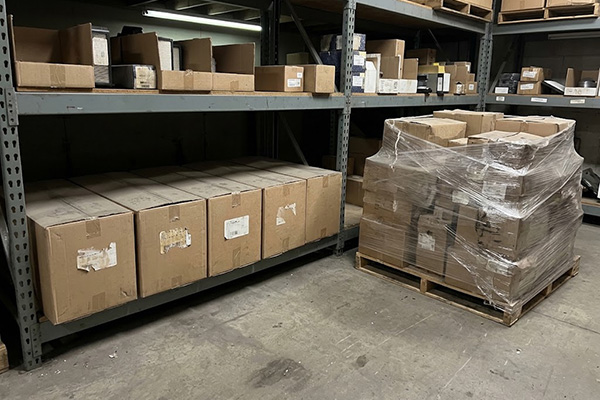
The costliest mistakes are assuming one list fits every variant of a model, ignoring running changes, trusting marketing descriptions without OE-number verification, ignoring operating conditions, and ordering everything at full depth on day one. Each one produces dead stock or downtime, and all are avoidable with better data and structured validation.
Mistake 1: One Universal List Per Model
The assumption: "All HOWO 371s use the same parts." The reality: Engine variant, year, and options create real differences. The cost: Dead stock that fits one variant but not another, often non-returnable on bulk orders.
Mistake 2: Ignoring Running Changes
The assumption: "Last year's part number still works." The reality: Part numbers are superseded when designs or suppliers change. The cost: Parts that bolt on but fail early, plus lost customer trust for distributors.
Mistake 3: Trusting Marketing Descriptions Over OE Numbers
The assumption: "The listing says 'fits SHACMAN F3000,' so it's correct." The reality: "Fits" may mean "fits some variants" or "looks similar." The cost: Returns, re-orders, and expensive international shipping delays.
Mistake 4: Underestimating Environmental Impact
The assumption: "We'll plan on the standard service interval." The reality: Severe conditions can shorten intervals sharply. The cost: Mid-cycle shortages, premium emergency purchases, idle trucks.
Mistake 5: Ordering the Full List at Maximum Depth on Day One
The assumption: "Better too much than too little." The reality: Without consumption data, quantities are guesses, and rubber parts and seals age on the shelf. The cost: Tied-up cash and eventual obsolescence write-offs.
How Do You Set First-Order Quantities and Reorder Triggers?
Once the part numbers are right for your fleet, the next decisions are how much to order first and when to reorder.
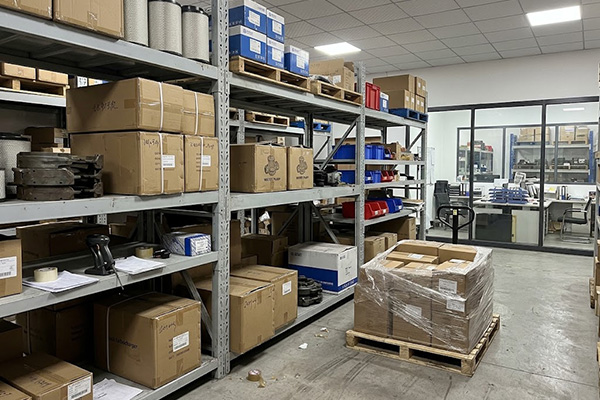
First-order quantities should cover estimated consumption during the lead time plus a safety buffer — not years of demand. For a new fleet, estimate from adjusted service intervals. Set the reorder trigger where remaining stock equals lead-time consumption plus safety stock, then refine both with real data in the first 3 to 6 months.
A Framework for First-Order Quantities
This is a starting framework that needs validation, not a formula to follow blindly.
| Item Category | First-Order Quantity Basis | Example |
|---|---|---|
| High-frequency consumables (filters, brake shoes, clutch facings) | Lead time × fleet consumption rate × 1.5 safety factor | 8-week lead time, 100 air filters used per 8 weeks → order 150 |
| Medium-frequency wear parts (water pumps, alternators, spring pins) | Indicatively 10–15% of fleet size | 50-truck fleet → 5–8 water pumps |
| Low-frequency critical spares (turbochargers, injector sets, ECUs) | 1–3 units regardless of fleet size | Avoids emergency air freight |
| Slow-moving body and cabin parts (mirrors, door handles, lights) | Known damage patterns or minimum order quantities | Order minimums; replenish on demand |
Setting Reorder Triggers
Reorder Point = (Average Daily Consumption × Lead Time in Days) + Safety Stock[9]
Use the full pipeline as lead time — production, inspection, shipping, and customs — which for international orders is indicatively 8–14 weeks, not factory time alone[10]. Avoid triggers set so low that you run out before the next container, or so high that stock piles up and part numbers change before you use it. Items held in supplier stock and items made to order need different triggers.
How Should You Validate Your Stock List in the First 3 to 6 Months?
Your initial stock list is a hypothesis. The first months of operation provide the data to prove or correct it.
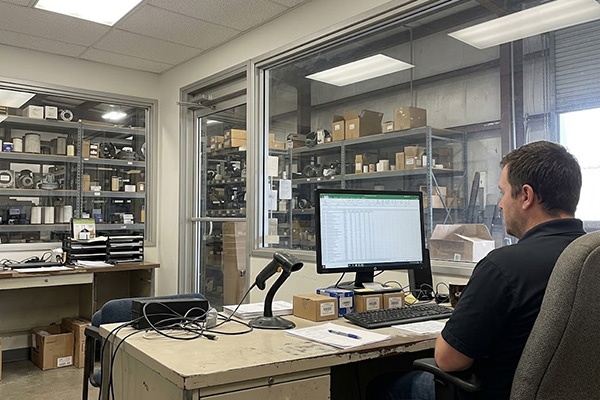
Validation means comparing assumptions against actual consumption: finding items that moved faster or slower than expected, catching parts never used (possible mismatches or over-estimates), and adjusting quantities and triggers. A simple spreadsheet recording each part issued, the truck, the reason, and the odometer reading will reshape your list from theory into reality within 3 to 6 months.
What to Track
- Part number and description
- Date issued and truck VIN or fleet number
- Reason for replacement (service, failure, damage)
- Odometer or engine hours
- Whether the part fit correctly
What to Look For at the 3-Month Review
- Fast movers. Raise quantities and investigate why: conditions, quality, or design.
- Items never used. Check whether they are long-cycle parts or mismatches that will never fit.
- Fit issues. Any part needing modification goes back for OE-number re-verification.
- Missing items. Parts needed but not listed are planning gaps to fill.
The 6-Month Adjustment
By six months you can reclassify items by consumption tier, replace estimates with data-driven reorder quantities, remove confirmed dead stock, add newly needed items, and negotiate pricing on demonstrated volumes.
A stock list not yet validated against six months of real consumption is still a draft.
Frequently Asked Questions
Can I use the same spare parts list across HOWO trucks of different model years?
Generally, no. Engines, transmissions, brakes, and cabins change across years and trims. Verify part numbers against each truck's VIN and engine nameplate.
What is the minimum vehicle data I should send to a parts supplier?
The full 17-character VIN, an engine nameplate photo, the model and production year, and clear photos of the component you need. A photo of the existing part is especially helpful for critical items.
How many SKUs should a typical fleet stock list include?
It depends on fleet size, brand mix, and conditions. Indicatively, a homogeneous 50-truck fleet might stock 150–250 active SKUs and a mixed fleet of similar size 400–700. Validate against real consumption.
Should I order all spare parts from a single supplier?
Consolidating with a supplier covering multiple brands and categories simplifies logistics and keeps identification consistent, provided they have the matching expertise for your specific fleet.
How often should I review and update my stock list?
Review at 3 months, adjust fully at 6 months, then quarterly. Also review whenever you add models, change routes, or see unexpected failure patterns.
Conclusion
Spare parts planning for Chinese truck fleets is a structured decision process, not a catalog exercise. It runs from accurate vehicle data through fleet composition, operating-condition adjustment, and disciplined first-order quantities, and the resulting list must be validated against real consumption in the first 3 to 6 months. Every shortcut along the way has a predictable cost.
At Caanass, we support this process daily with 40,000+ SKUs across HOWO, SHACMAN, FAW, FOTON, and DONGFENG and a team experienced in OE-number matching across assembly variants. Send us your vehicle data and we will work through the matching with you.
Email: grand@caanass.com | WhatsApp: +86 19924698529
- [1]"General Motors GMT platform", https://en.wikipedia.org/wiki/General_Motors_GMT_platform. Manufacturer product catalogs from Sinotruk, Shaanxi Auto, and FAW list numerous configuration options under each model designation, with the HOWO range alone offering multiple engine families, transmission types, axle ratios, and cab variants that produce dozens of distinct assembly specifications under a single model name. Evidence role: general_support; source type: other. Supports: Major Chinese truck model designations such as HOWO, SHACMAN F3000, and FAW J6 each encompass a wide range of configurations varying by engine, transmission, axle, cab type, and emission standard.. Scope note: Exact counts of configurations are difficult to verify externally as they depend on how variants are defined; manufacturer catalogs confirm broad configurability but may not enumerate every combination produced. ↩
- [2]"China National Heavy Duty Truck Group", https://en.wikipedia.org/wiki/China_National_Heavy_Duty_Truck_Group. Sinotruk has progressively updated the HOWO platform, migrating from the WD615 engine family to the MAN-technology-derived MC11 and MC13 series, while also upgrading transmissions and introducing disc brake options on newer variants such as the T7H. Evidence role: historical_context; source type: other. Supports: Sinotruk's HOWO platform evolved through multiple generations, transitioning from WD615-series engines to MC-series engines and introducing new transmission and brake system options across production years.. Scope note: Detailed year-by-year BOM changes are typically proprietary and not publicly documented; available sources may only confirm broad generational shifts rather than specific running changes. ↩
- [3]"Facelift (automotive)", https://en.wikipedia.org/wiki/Facelift_(automotive). Running changes are a recognized phenomenon in automotive manufacturing whereby component specifications, suppliers, or materials are altered during a production cycle without a corresponding change to the vehicle model designation, complicating aftermarket parts cataloging and fitment accuracy. Evidence role: mechanism; source type: research. Supports: Running engineering changes — modifications to components or suppliers during a model's production cycle without a formal model redesignation — are a standard practice in automotive manufacturing that creates well-documented challenges for aftermarket parts identification.. Scope note: General automotive engineering literature documents this practice broadly; specific documentation of its frequency or severity in Chinese truck manufacturing is limited in publicly available sources. ↩
- [4]"Experimental Study of Filtration Materials Used in the Car Air ...", https://pmc.ncbi.nlm.nih.gov/articles/PMC7475895/. SAE technical papers and filter manufacturer data demonstrate that airborne dust concentrations in mining and construction environments can exceed standard operating assumptions by 5–20 times, resulting in air filter restriction reaching service limits at a fraction of the manufacturer's recommended interval. Evidence role: general_support; source type: research. Supports: High dust concentrations in mining and off-road environments significantly reduce air filter service life, often requiring replacement at 50% or less of the manufacturer's standard interval.. Scope note: Actual filter life reduction depends on dust particle size distribution, filter media specification, and whether pre-cleaners are fitted; the general principle is well-supported but specific replacement intervals must be determined by restriction monitoring. ↩
- [5]"Experimental Dust Absorption Study in Automotive Engine ...", https://pmc.ncbi.nlm.nih.gov/articles/PMC11242612/. Published research on diesel engine durability in dusty environments has established that silica and alumina particles bypassing air filtration systems cause abrasive wear on turbocharger seals, piston rings, cylinder liners, and valve guides, with wear rates correlating to particle concentration and size distribution in the intake air. Evidence role: mechanism; source type: paper. Supports: Ingestion of airborne dust particles, particularly silica-rich dust, causes abrasive wear on turbocharger compressor seals, piston rings, cylinder liners, and valve guides in diesel engines.. Scope note: The severity of internal wear depends on air filtration efficiency, particle size, and engine design; the mechanism is well-documented but quantitative wear rates vary significantly across studies and operating conditions. ↩
- [6]"Formula SAE cooling system design and optimization", https://researchdiscovery.drexel.edu/view/pdfCoverPage?instCode=01DRXU_INST&filePid=13321528040004721&download=true. Automotive reliability studies confirm that sustained high ambient temperatures reduce the service life of cooling system components by increasing thermal cycling stress and accelerating the chemical degradation of elastomeric materials such as hoses and seals, consistent with Arrhenius-type acceleration of polymer aging. Evidence role: mechanism; source type: research. Supports: Elevated ambient temperatures increase thermal loading on vehicle cooling systems, accelerating degradation of radiators, water pumps, thermostats, and rubber hoses through mechanisms including thermal fatigue, accelerated oxidation, and reduced coolant efficiency.. Scope note: Quantitative acceleration factors depend on specific temperature ranges, material compositions, and coolant maintenance practices; the general mechanism is well-established but precise failure-rate multipliers are application-specific. ↩
- [7]"(PDF) Vehicle Overloading: A Review", https://www.academia.edu/43512887/Vehicle_Overloading_A_Review. Research on commercial vehicle overloading has demonstrated that sustained loads exceeding rated capacity accelerate fatigue failure in suspension components, increase brake and clutch wear rates, and reduce bearing service life, with effects that scale non-linearly with the degree of overload. Evidence role: mechanism; source type: research. Supports: Systematic overloading of commercial vehicles accelerates fatigue and wear on load-bearing components including leaf springs, wheel bearings, king pins, and clutch assemblies, reducing their service life significantly below manufacturer specifications.. Scope note: Most published studies focus on road damage and safety rather than component-specific wear rates; precise multipliers vary by component design and overload magnitude. ↩
- [8]"Publication: Pakistan Clean Fuels - Open Knowledge Repository", https://openknowledge.worldbank.org/entities/publication/c2714fe5-686d-5d38-b983-36086bafce58. The International Council on Clean Transportation and similar bodies have documented that high-sulfur diesel fuel contributes to accelerated fuel injector wear, increased filter clogging, and elevated engine maintenance costs, particularly in regions where fuel sulfur content exceeds 500 ppm. Evidence role: general_support; source type: institution. Supports: High-sulfur and contaminated diesel fuel accelerates wear on fuel system components including injectors and filters, a problem particularly prevalent in markets with less stringent fuel quality standards.. Scope note: Institutional reports typically address fuel quality at a policy level; component-specific wear rates depend on engine design, injection pressures, and the specific contaminants present. ↩
- [9]"Reorder point", https://en.wikipedia.org/wiki/Reorder_point. The reorder point model, defined as the sum of expected demand during lead time and a safety stock buffer, is a standard inventory control method described in operations management literature, originally formalized in economic order quantity and continuous review inventory models. Evidence role: definition; source type: encyclopedia. Supports: The reorder point formula (average demand during lead time plus safety stock) is a foundational concept in inventory management theory used to determine when to place replenishment orders.. Scope note: The basic formula assumes relatively stable demand and lead times; real-world applications for spare parts with lumpy or intermittent demand patterns may require more sophisticated approaches such as Poisson-based or bootstrapping methods. ↩
- [10]"China - U.S. Export Controls", https://www.trade.gov/country-commercial-guides/china-us-export-controls. Industry logistics data indicates that end-to-end supply chain lead times from Chinese manufacturing to delivery in African and Middle Eastern markets typically range from 8 to 16 weeks, encompassing production scheduling, ocean transit times of 3–6 weeks depending on destination, and customs clearance procedures. Evidence role: general_support; source type: institution. Supports: Total supply chain lead times for manufactured goods exported from China, encompassing production, quality inspection, ocean freight, and destination customs clearance, commonly fall in the 8–14 week range for African, Middle Eastern, and Southeast Asian destinations.. Scope note: Lead times are highly variable depending on port congestion, shipping route, customs efficiency at destination, and whether goods are made to order or from stock; the 8–14 week range is a reasonable central estimate but not universally applicable. ↩